
Welcome to our 2023 Stock Rover review, where we will be taking a deep dive into one of the most powerful investment analysis tools currently available.
In today’s fast-paced financial world, having access to reliable and comprehensive data is crucial for making informed investment decisions. Stock Rover has been providing investors with detailed insights into the stock market for years, and it continues to evolve and improve its services based on the needs of its users.
In our Stock Rover review, we’ll explain what the investment platform is, why it’s so valuable, how much it might cost, and who this platform is best suited for. Whether you’re a seasoned investor or just starting out, this review will help you determine if Stock Rover is the right tool for your investment strategy. So, let’s dive in and take a closer look at what Stock Rover has to offer in 2023.
In this article we’ll cover:
- What is Stock Rover?
- How Does Stock Rover Work?
- How Much Does Stock Rover Cost?
- Who Should Use Stock Rover?
- Is Stock Rover Worth It?
What is Stock Rover?

Stock Rover is an investment research platform that provides users with valuable information on thousands of publicly traded companies and funds.
Specifically, Stock Rover is geared towards long term investors through comprehensive research reports, Stock Rover ratings, and portfolio analysis tools, as well as short term traders through its robust technical analysis capabilities.
Founded in 2008, the platform was created to “simplify and improve the way investors perform research, make decisions, and track investments”.
Founders Howard Reisman and Andrew Martin created the Stock Rover platform to take the complications and guesswork out of conducting detailed research on specific companies, mutual funds, and ETF’s. The two software engineers became frustrated with the overwhelming amount of information available, without there being a tool to organize and understand it in a simple way.
To fix this problem, they set out to build a one-stop-shop solution for investors combining both fundamental and technical analysis into one cohesive site. The result of their hard work was the Stock Rover dashboard, which has quickly become one of the most trusted and respected stock research sites in the world.
How Does Stock Rover Work?
Stock Rover provides an all-in-one web-based platform for investors to perform their research and decide which investment opportunities are worth their capital. The platform has numerous capabilities that allow users to breakdown and compare stocks in a variety of different ways by using popular metrics and strategies.
Stock Rovers value can be broken down into 5 main categories, each providing investors with a different perspective and analysis when conducting their research.
Let’s take a closer look at each category to better understand the value Stock Rover provides:
1. Stock Screener
One of the hardest parts for investors (whether you’re a long term buy-and-hold investor or short term trader) is finding quality stocks to invest in. Trying to find that needle in the haystack can seem almost impossible without having a way to sort equities or other assets based on specific characteristics.
Understanding this problem, Stock Rover’s platform has over 14o prebuilt screeners for investors to choose from. Whether you’re looking to find cash flow positive businesses with low PE ratios or are searching for stocks whose price has consolidated above their 50-day moving average and is looking ready to breakout, the Stock Rover research platform can help you find thousands of stocks that meet a specific criteria in seconds.
With the ability to create your own screeners based on specific metrics, or copy the investing strategies of famous investors such as Warren Buffet or Peter Lynch through Stock Rover’s Guru Screeners, as well as write custom equations to filter through historical data, Stock Rover provides a great foundation for investors to begin their research.
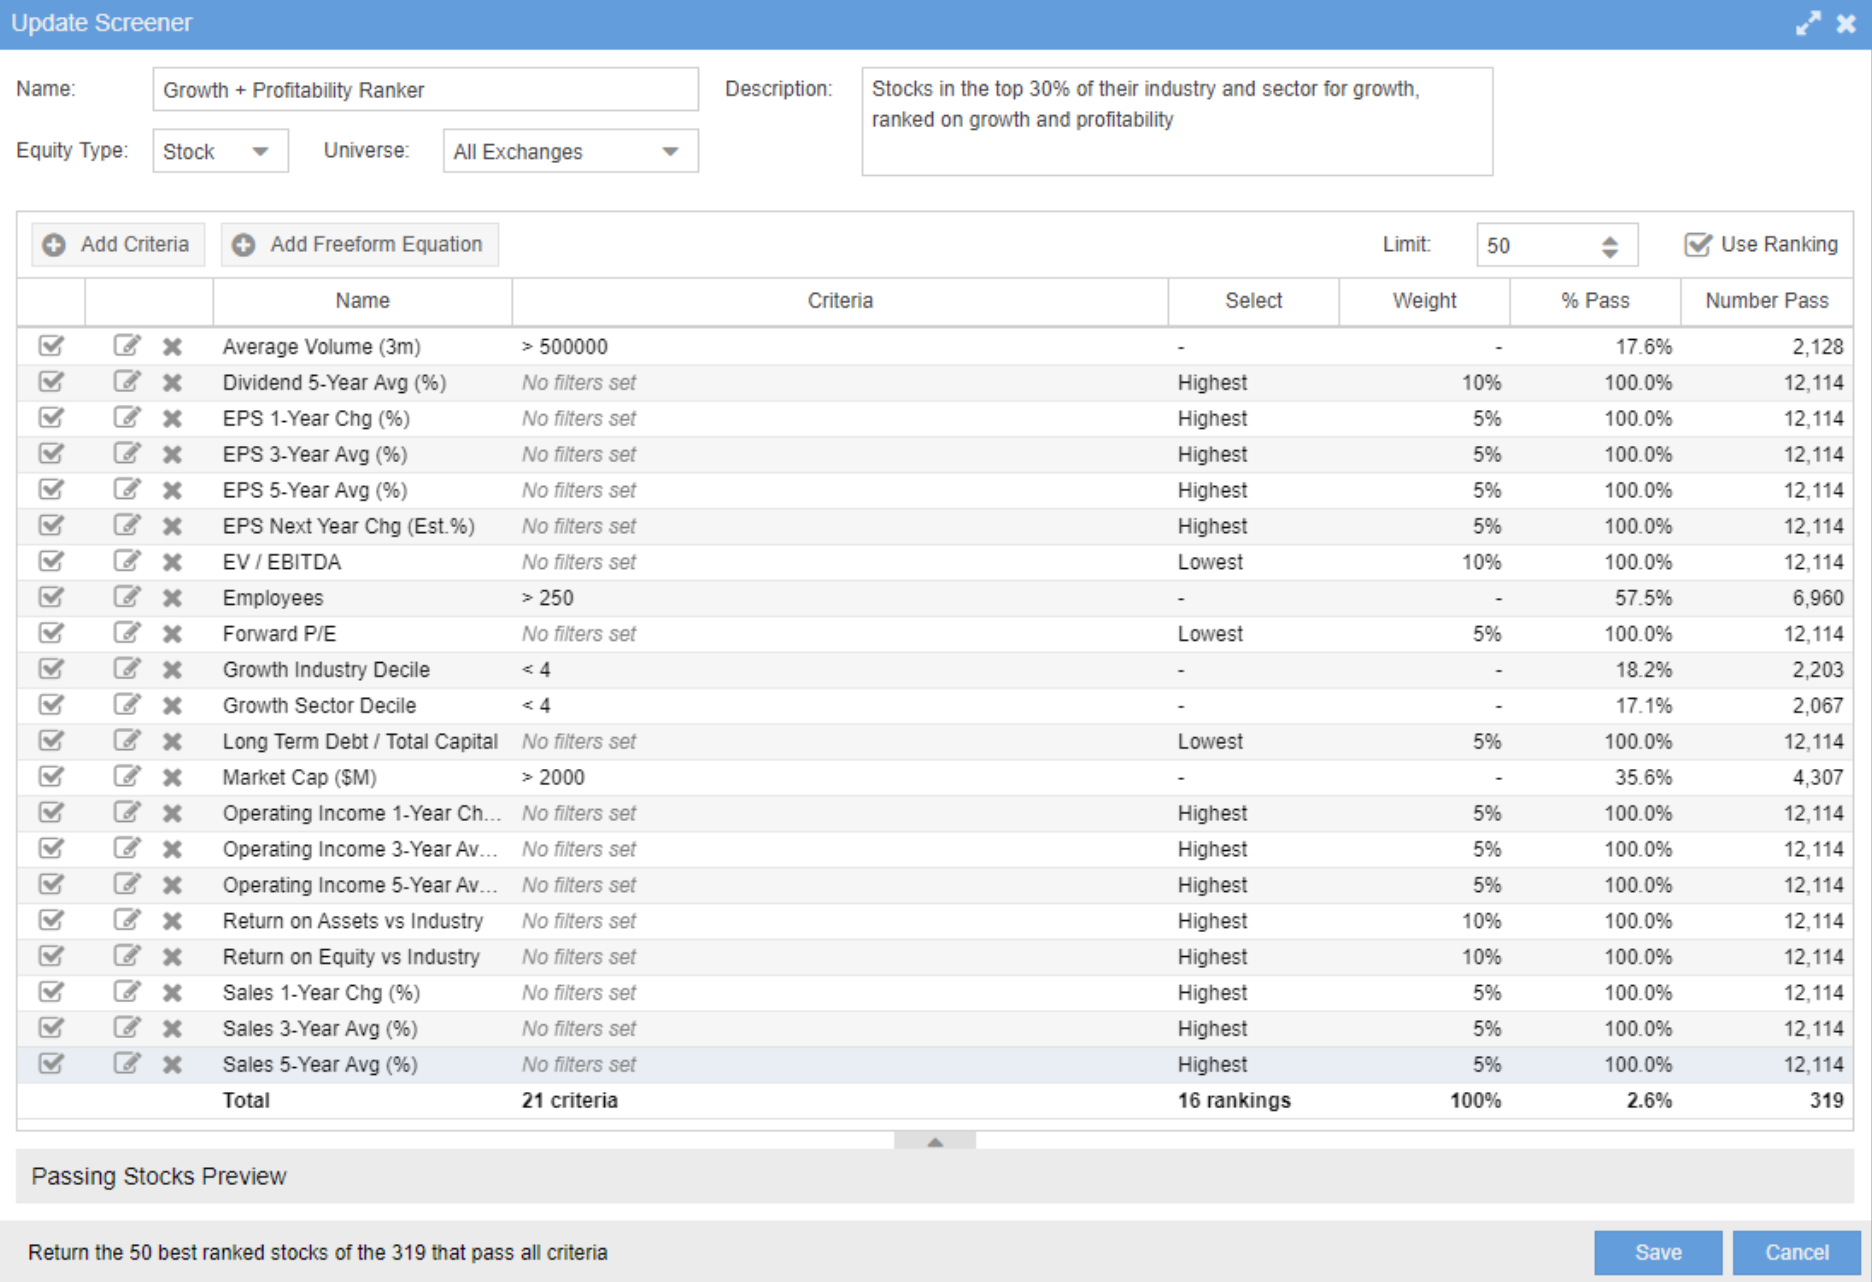
Finally, Stock Rover will also allow you to add weight to your specific criteria in order to generate a ranking of stocks. The picture below shows the long list of weightings and categories users can change to not only screen stocks but also rank them based off varying factors.
2. Compare Stocks
Having various stock screening tools is great to get you started, however, to truly make informed investment decisions you’ll have to be able to compare potential investment opportunities against each other.
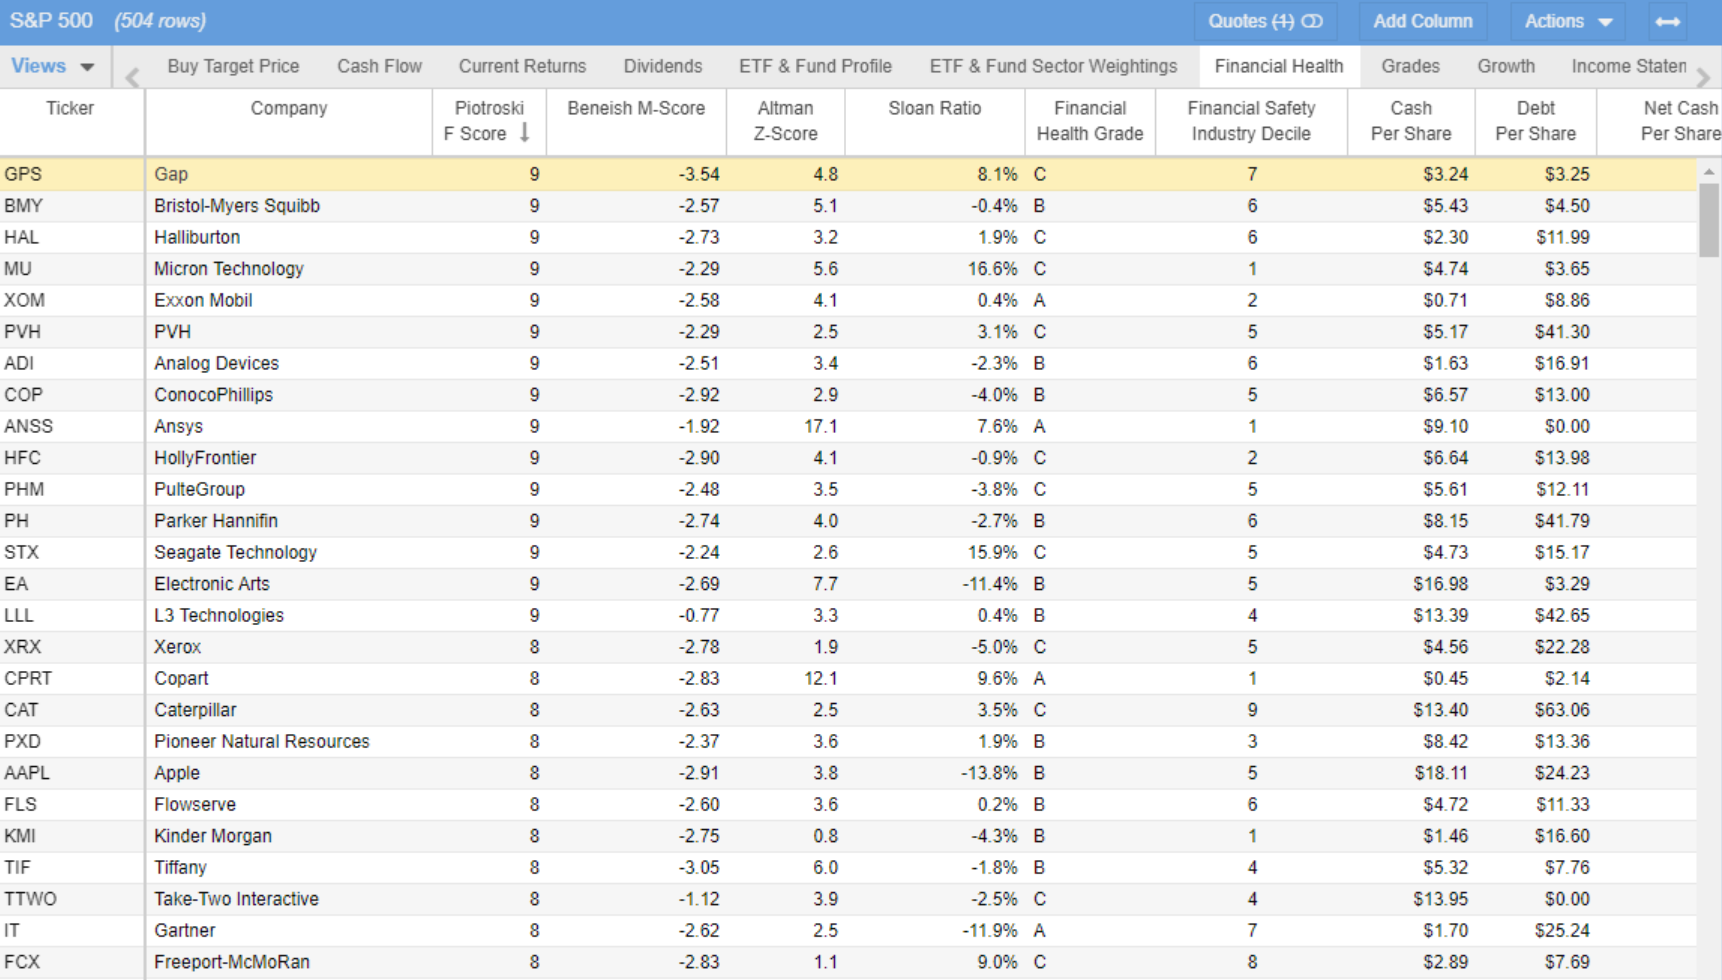
What Stock Rover has called “The Table” is their incredibly powerful comparison tool allowing investors to sort, filter, color rows, and even add comments. With The Table, you can add stocks one-by-one, or index-by-index, and then compare hundreds of financial metrics based on categories such as growth, valuation, momentum, dividends, and historical returns. See the pictured example below of what The Table looks like in action:

The comparison functionalities don’t end with The Table however. As not only does Stock Rover let you compare stocks, ETF’s and mutual funds, it also provides fund insights, investor warnings, estimated fair value and margin of safety information, stocks ratings, and the ability to compare against industry peers or past performance. Below is another example of a stock rating report of technology company Meta Platforms, as well as a stock insight report for e-commerce firm Amazon provided by Stock Rover’s comparison tools.
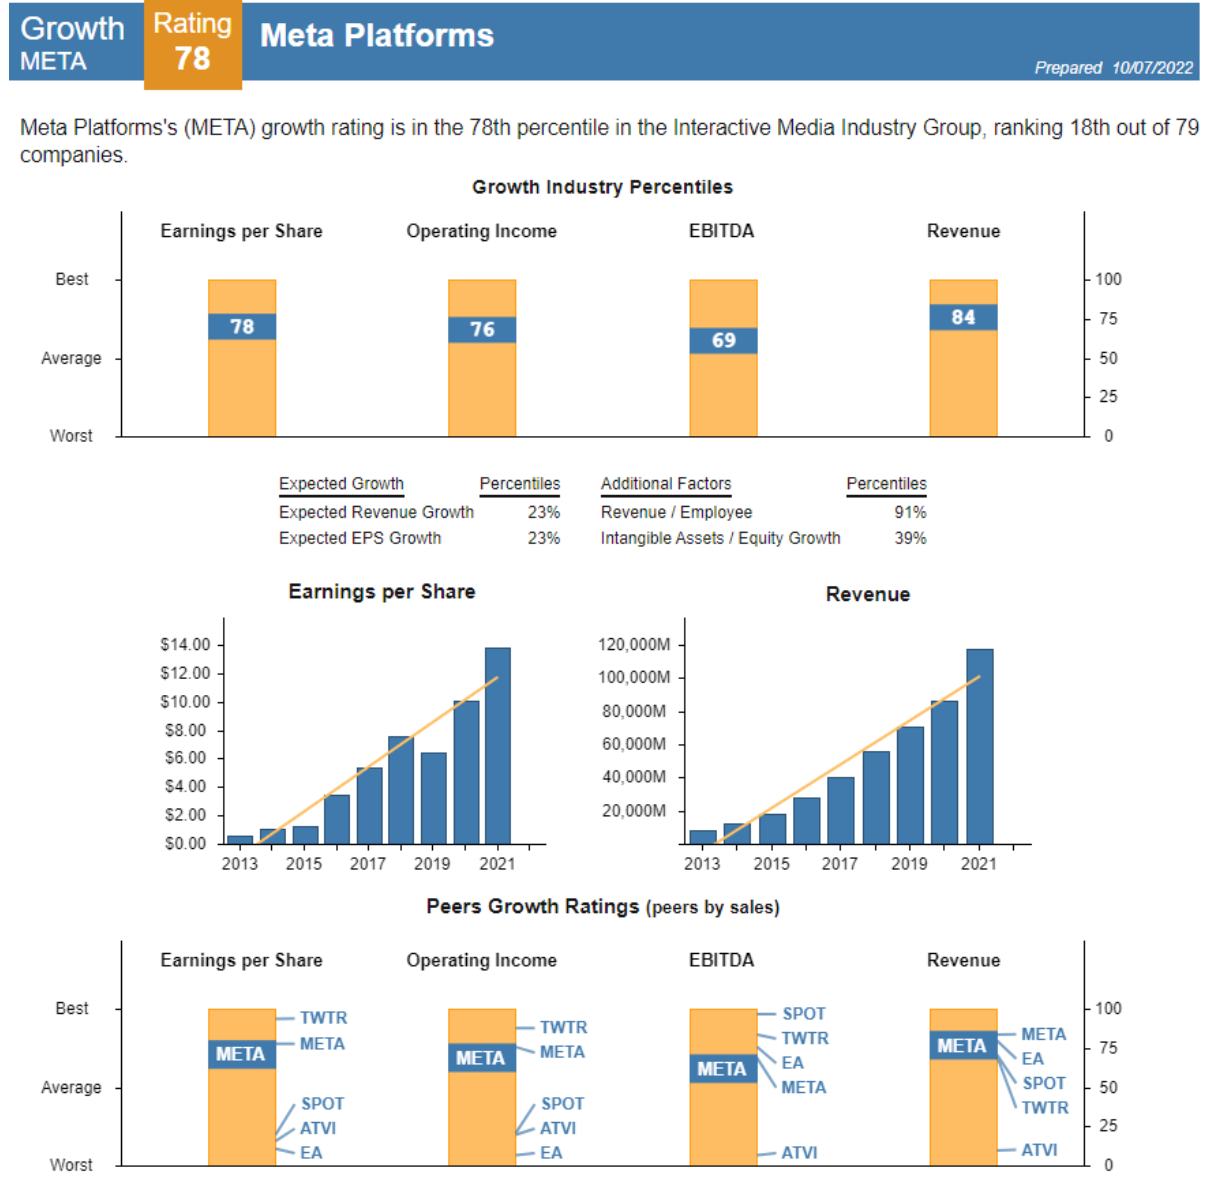
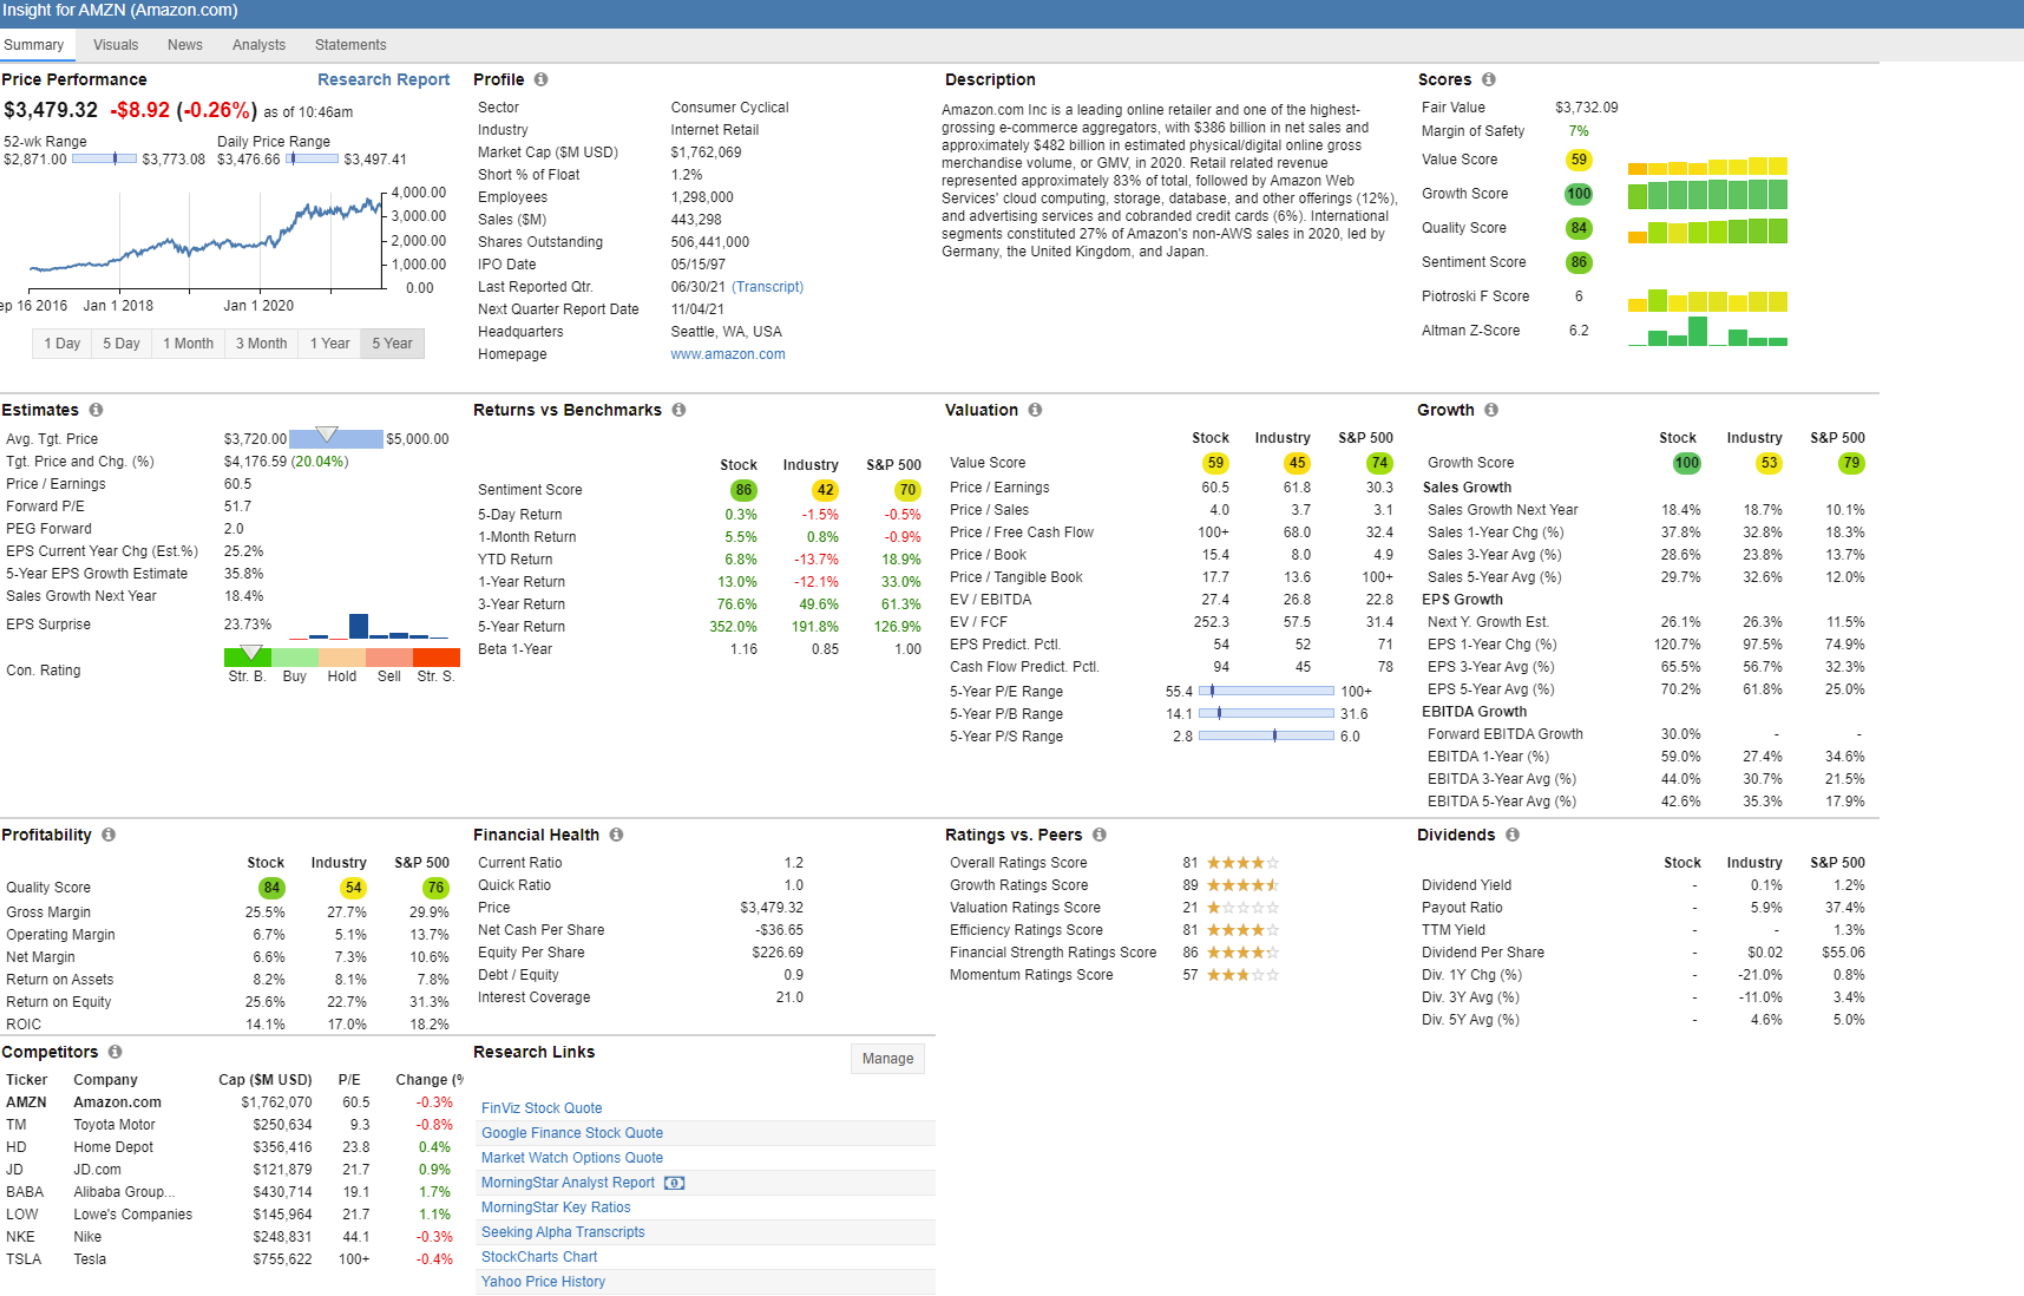
All of Stock Rover’s comparison functionalities are presented on data rich, easy to read charts and can be a phenomenal way for investors to analyze a company’s financial information, as well as compare their performance amongst industry peers to better understand the ability for a firm to outperform moving forward.
3. Research Reports
Geared towards long term investors, Stock Rover’s research reports are designed to give their users an in-depth and comprehensive overview of a specific company. From analyst ratings, valuation data, and growth metrics, to price performance, risk vs return scores, and even the seasonality of a stock’s price movements, the research reports provided by Stock Rover’s insight panel will give investors an extensive overview of any publicly traded company. (To see over 30 sample Stock Rover research reports, click here). The pictures below show a sample of the first two pages from a research report by Stock Rover for software company Microsoft.
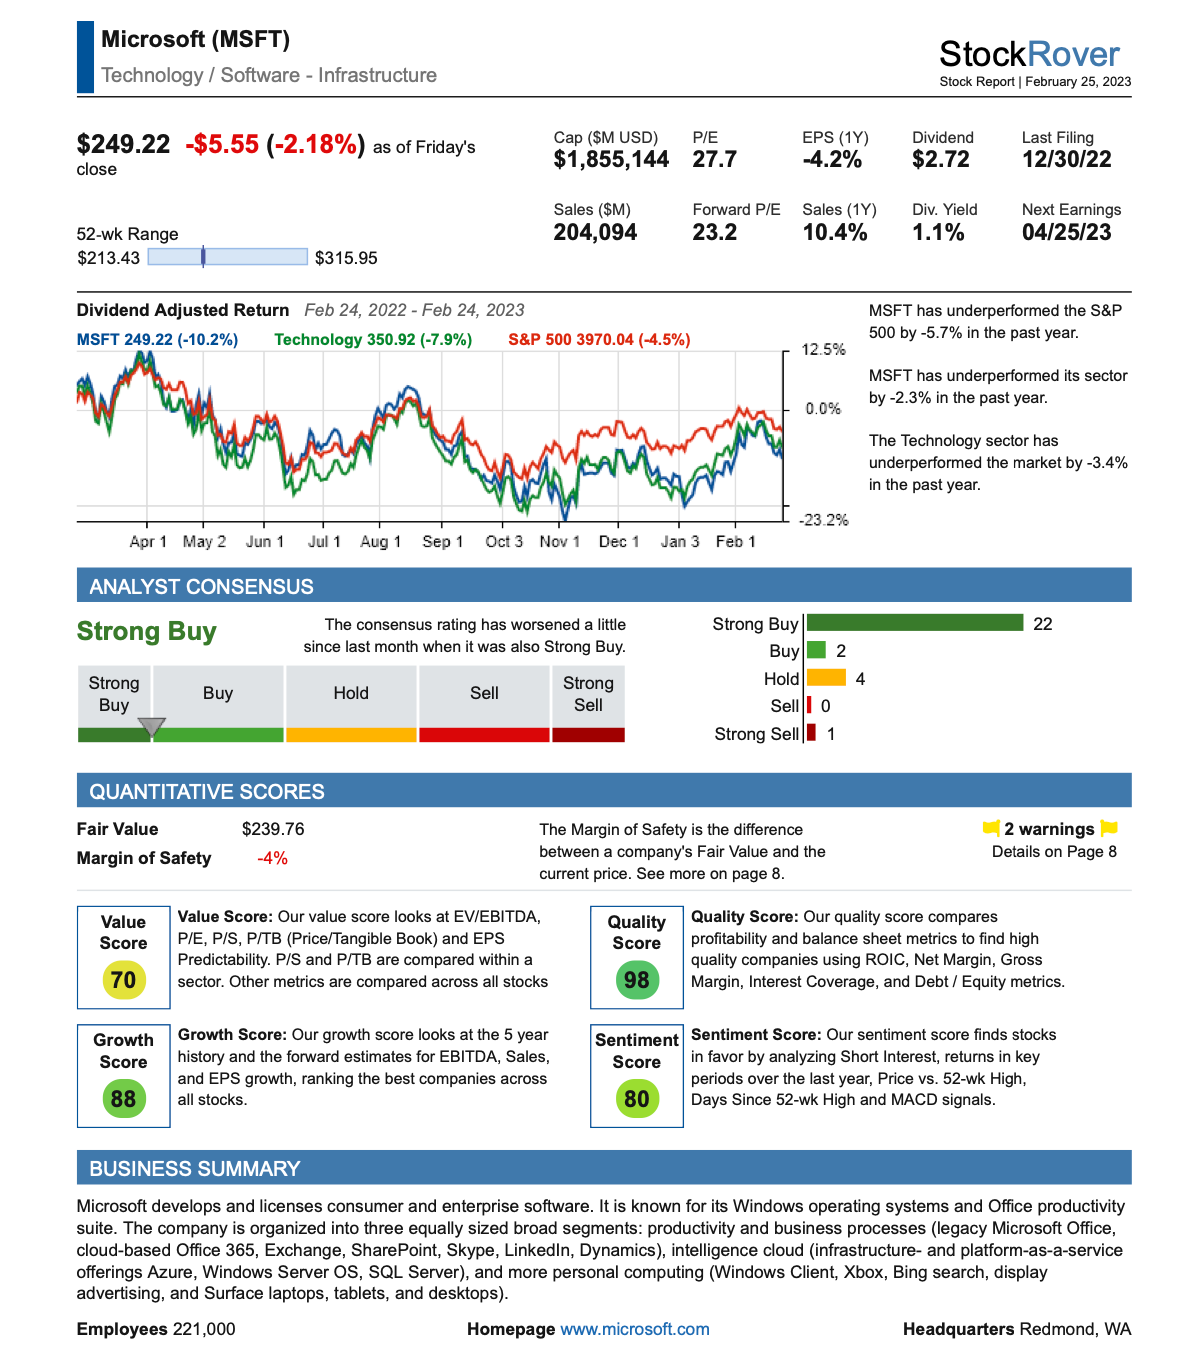
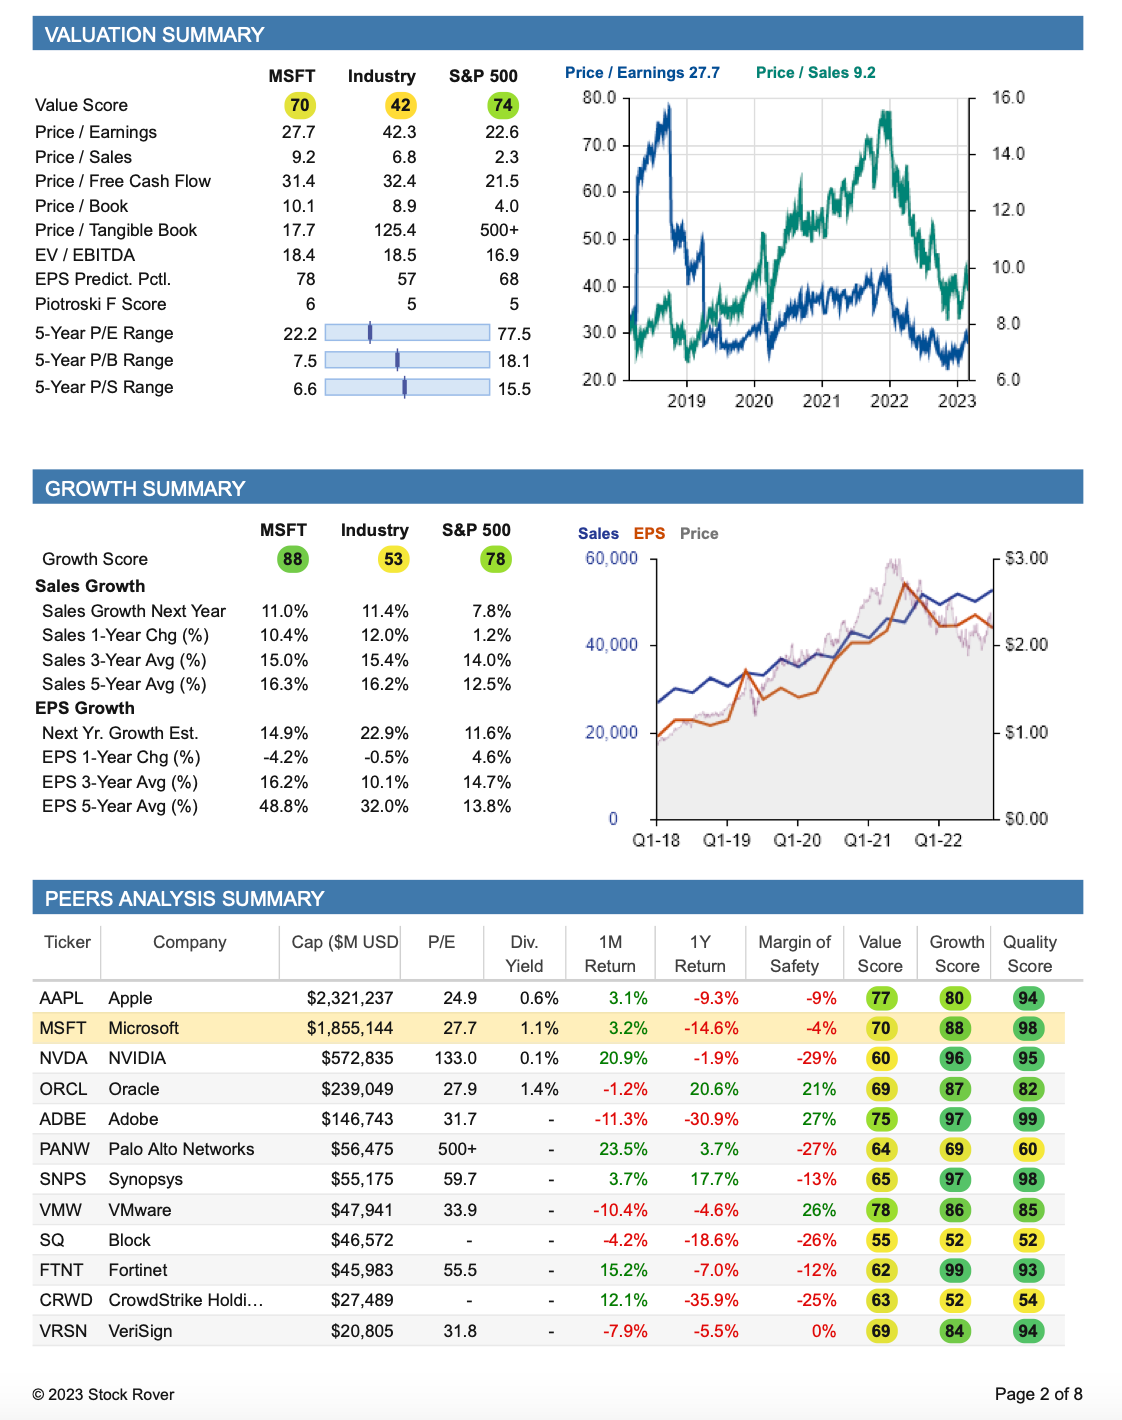
These research reports are available for over 7,000 stocks covered within the Stock Rover library and provides unique value to investors who are looking for more than just a basic overview of what a company does, how they operate, and their financial positioning.
4. Portfolio Management
With an entire stack of portfolio management tools at your finger tips, Stock Rover allows investors to understand gaps, opportunities, and hidden risks within their portfolio in minutes.
More specifically, Stock Rover provides not only portfolio performance, but also brokerage integration (allowing investors to link their brokerage account directly to the Stock Rover platform), automatic portfolio reports sent straight to your email, detailed portfolio analytics showing top performers and risk adjusted returns, projected dividend income, correlation analysis tools, and countless other features.
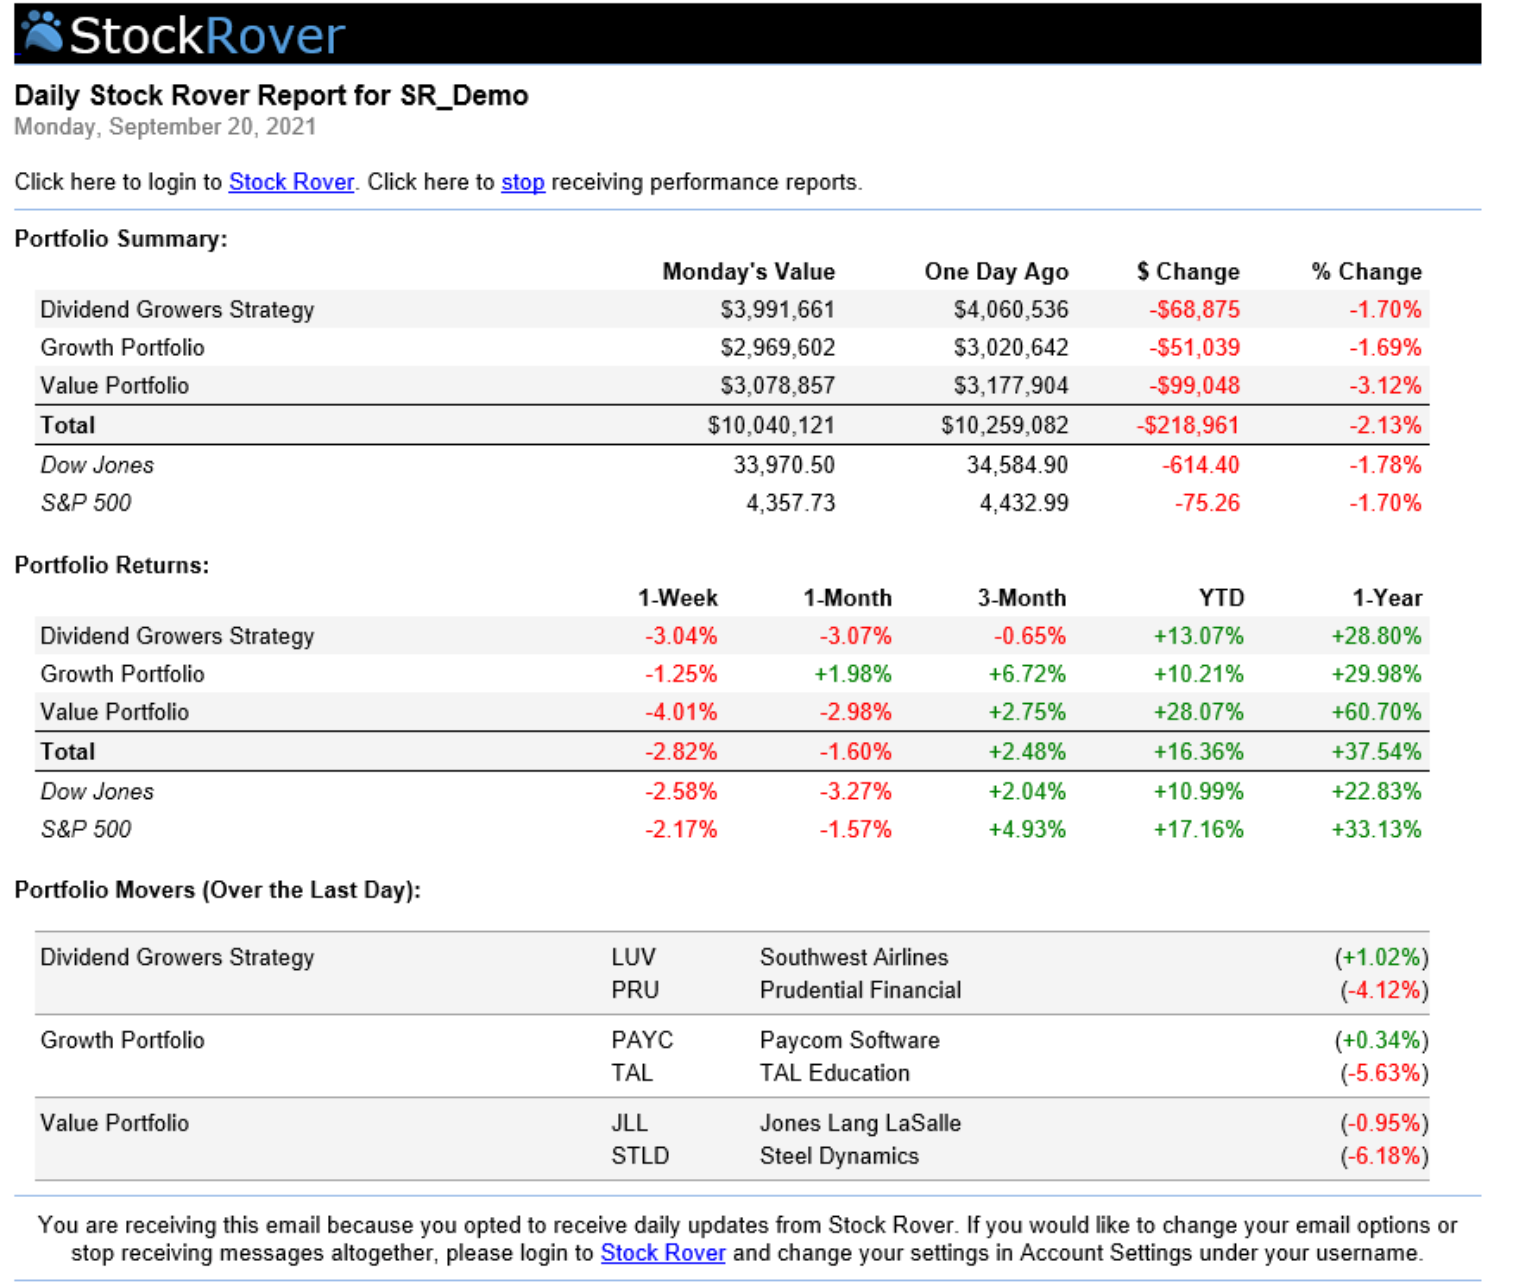
The above picture shows an example of Stock Rover’s portfolio management report, highlighting portfolio returns, top movers, and a quick summary. Where Stock Rover really outperforms, is allowing the user to customize these reports to best suit their needs, financial goals, and preferences.
Stock Rover gives investors a complete portfolio management tool to help them manage their risk, project future returns, estimate annual dividend income, and overall better understand how they have positioned themselves in the market.
5. Charting
Stock Rover also allows investors to analyze various technical indicators using advanced graphing and powerful charting techniques. Below are the technical indicators currently supported on the Stock Rover platform and brief explanation of each:
- Accumulation/Distribution: A momentum indicator that uses volume to measure buying and selling pressure of a stock.
- Aroon Indicator: Used to analyze an equities price trend and how strong the trend is by measuring the time between the most recent high or low and the high or low of a specified period.
- Average Directional Index: Measures the strength of a trend, as well as the direction of the trend, without regard to whether the trend is up or down.
- Average True Range: Measures volatility by analyzing the size of price ranges over a specified period of time.
- Bollinger Bands: Uses a moving average with two standard deviations to determine price volatility and identify potential trend reversals.
- Exponential Moving Average: A moving average that places greater weight on more recent price data, which can identify trend changes faster.
- Keltner Channels: Uses a moving average and two bands to identify potential breakout scenarios based on price volatility and momentum.
- Money Flow Index: Combines price and volume data to identify potential trend reversals, by measuring buying and selling pressure.
- Moving Average Convergence Divergence: Uses two moving averages to identify inflection points of a stock’s price, based on changes in momentum.
- On Balance Volume: Measures buying and selling pressure based on volume data.
- Relative Strength Index: Measures the strength of a stock’s price movement, and helps identify potential overbought or oversold conditions.
- Stochastic Oscillator: Is a momentum indicator that compares a stock’s closing price to its price range over a specified period.
- Simple Moving Average: A moving average that calculates the average price over a specified period.
- Volume: A measure of how many shares of a particular stock are being traded over a specified period of time.
- Williams %R Indicator: A momentum indicator that compares a stock’s closing price to its price range over a specified period, with the intent of identifying periods of being oversold or overbought.
Stock Rover also takes the datasets provided in the fundamental-focused research reports and allows investors to view this information graphically.
By charting a company’s share price compared to specific fundamental metrics like earnings per share or charting a firms valuation vs industry wide averages lets individual investors create a visual representation of critical data when analyzing stocks.
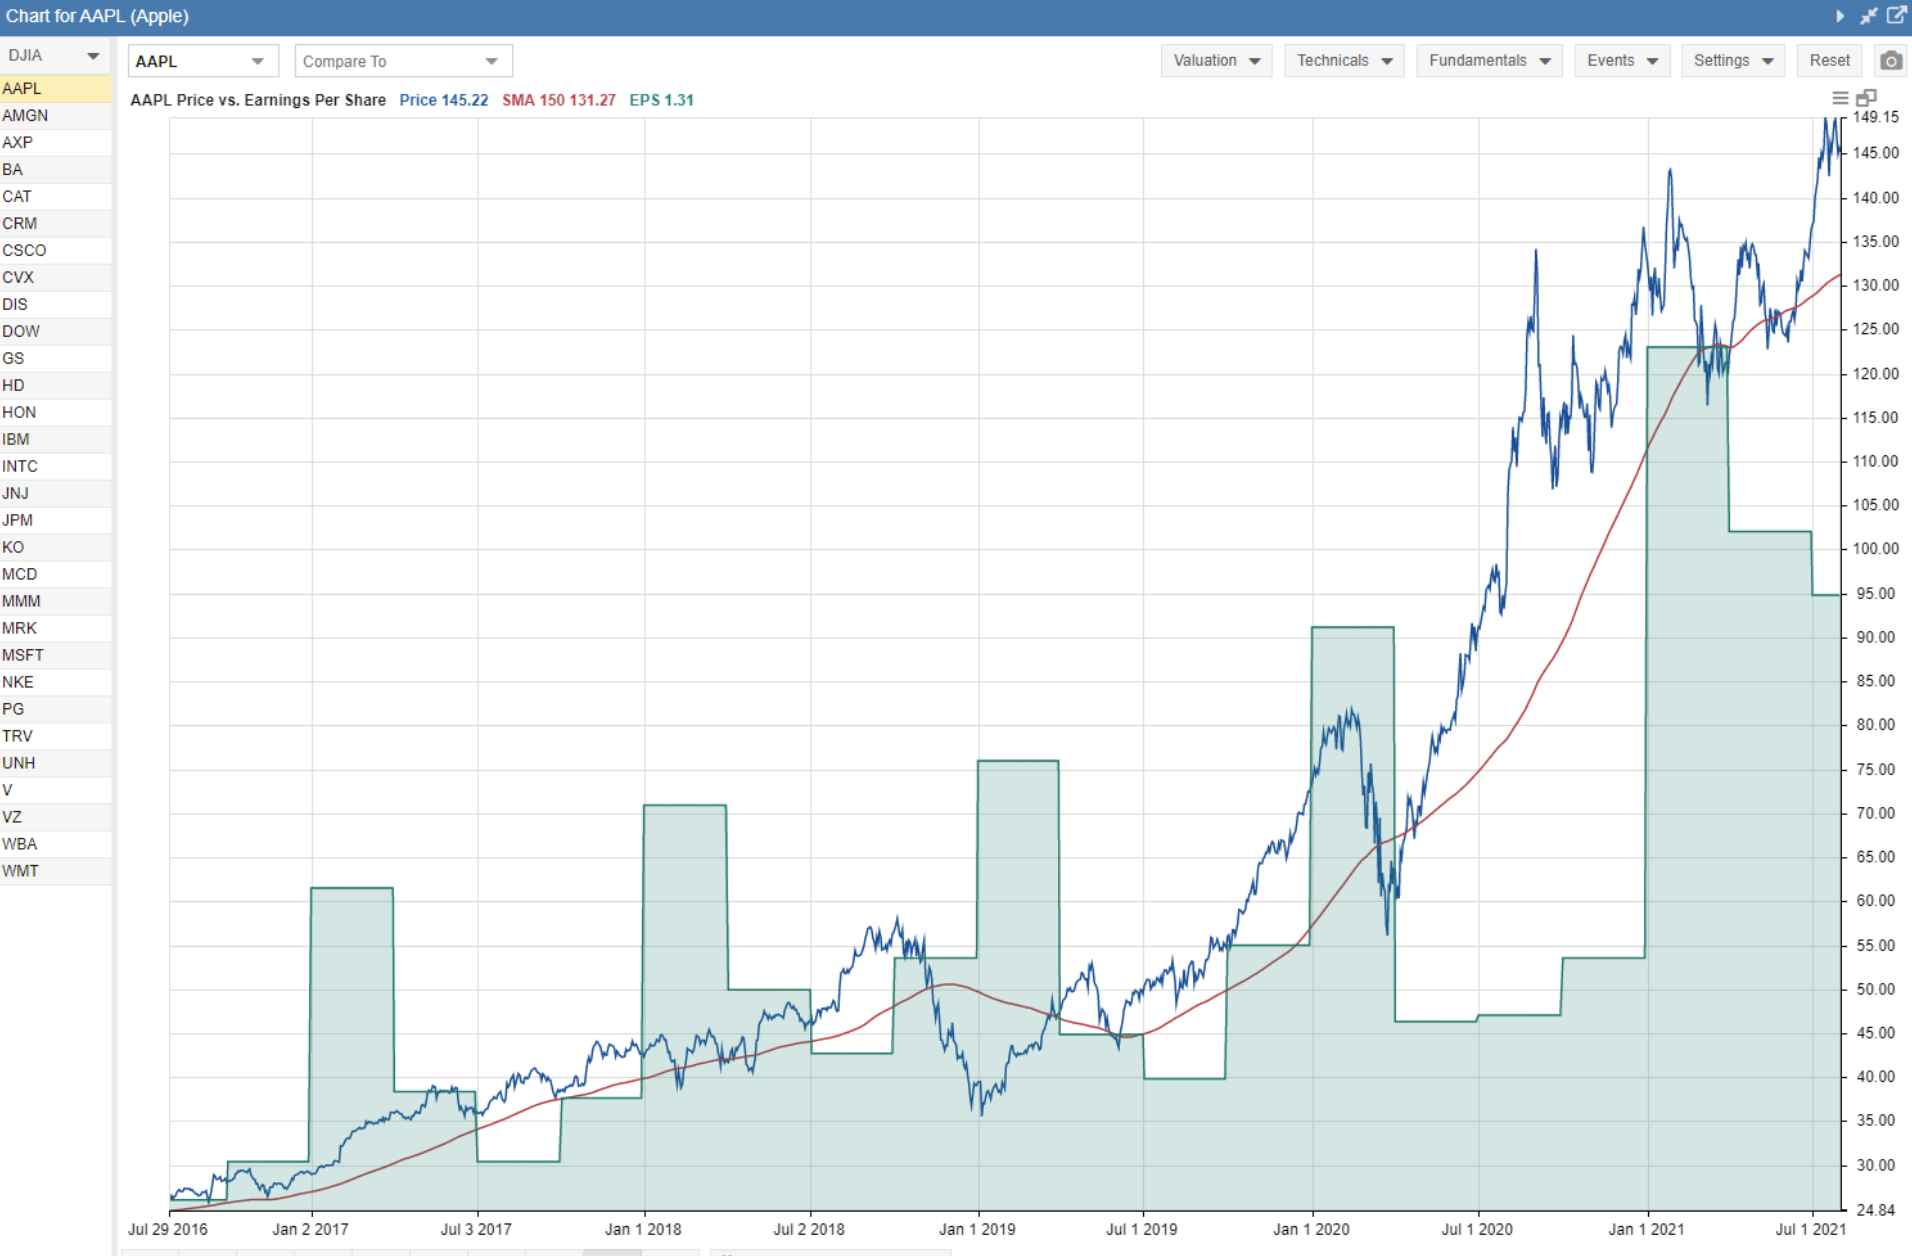
The example above shows Stock Rover comparing Apple’s stock price compared to their EPS over a four-year period.
Additionally, Stock Rover will also let you compare these metrics to their 5-year (or other time frame) average using their very unique football field chart (see below).
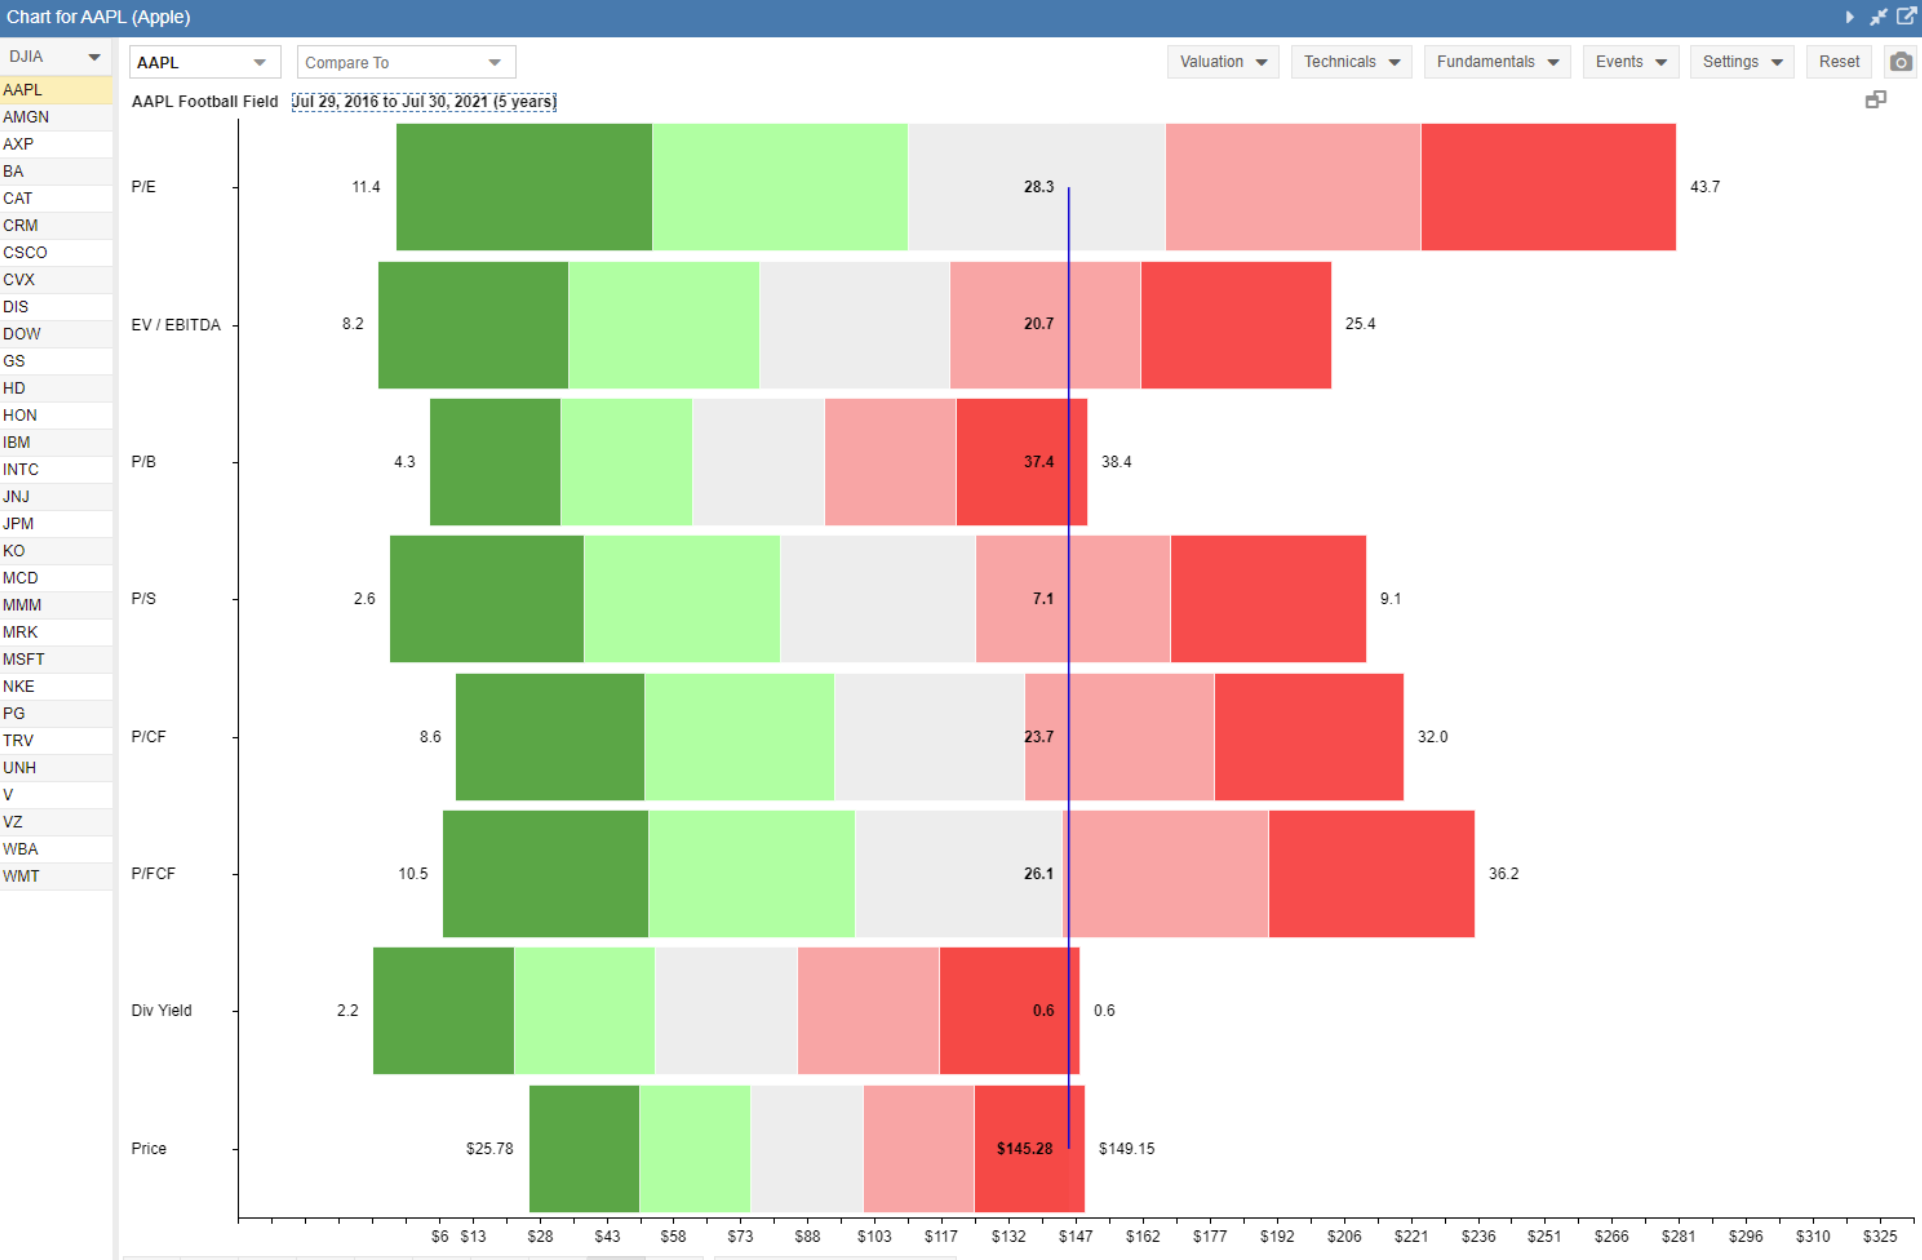
This allows users to better understand a companies underlying fundamentals and historical data, providing clarity and insight into a companies current ability to generate returns.
Overall, Stock Rover has built a very powerful charting functionality for their users to not only perform in-depth stock analysis but also combine this research with various technical analysis strategies commonly used by professional investors.
How Much Does Stock Rover Cost?
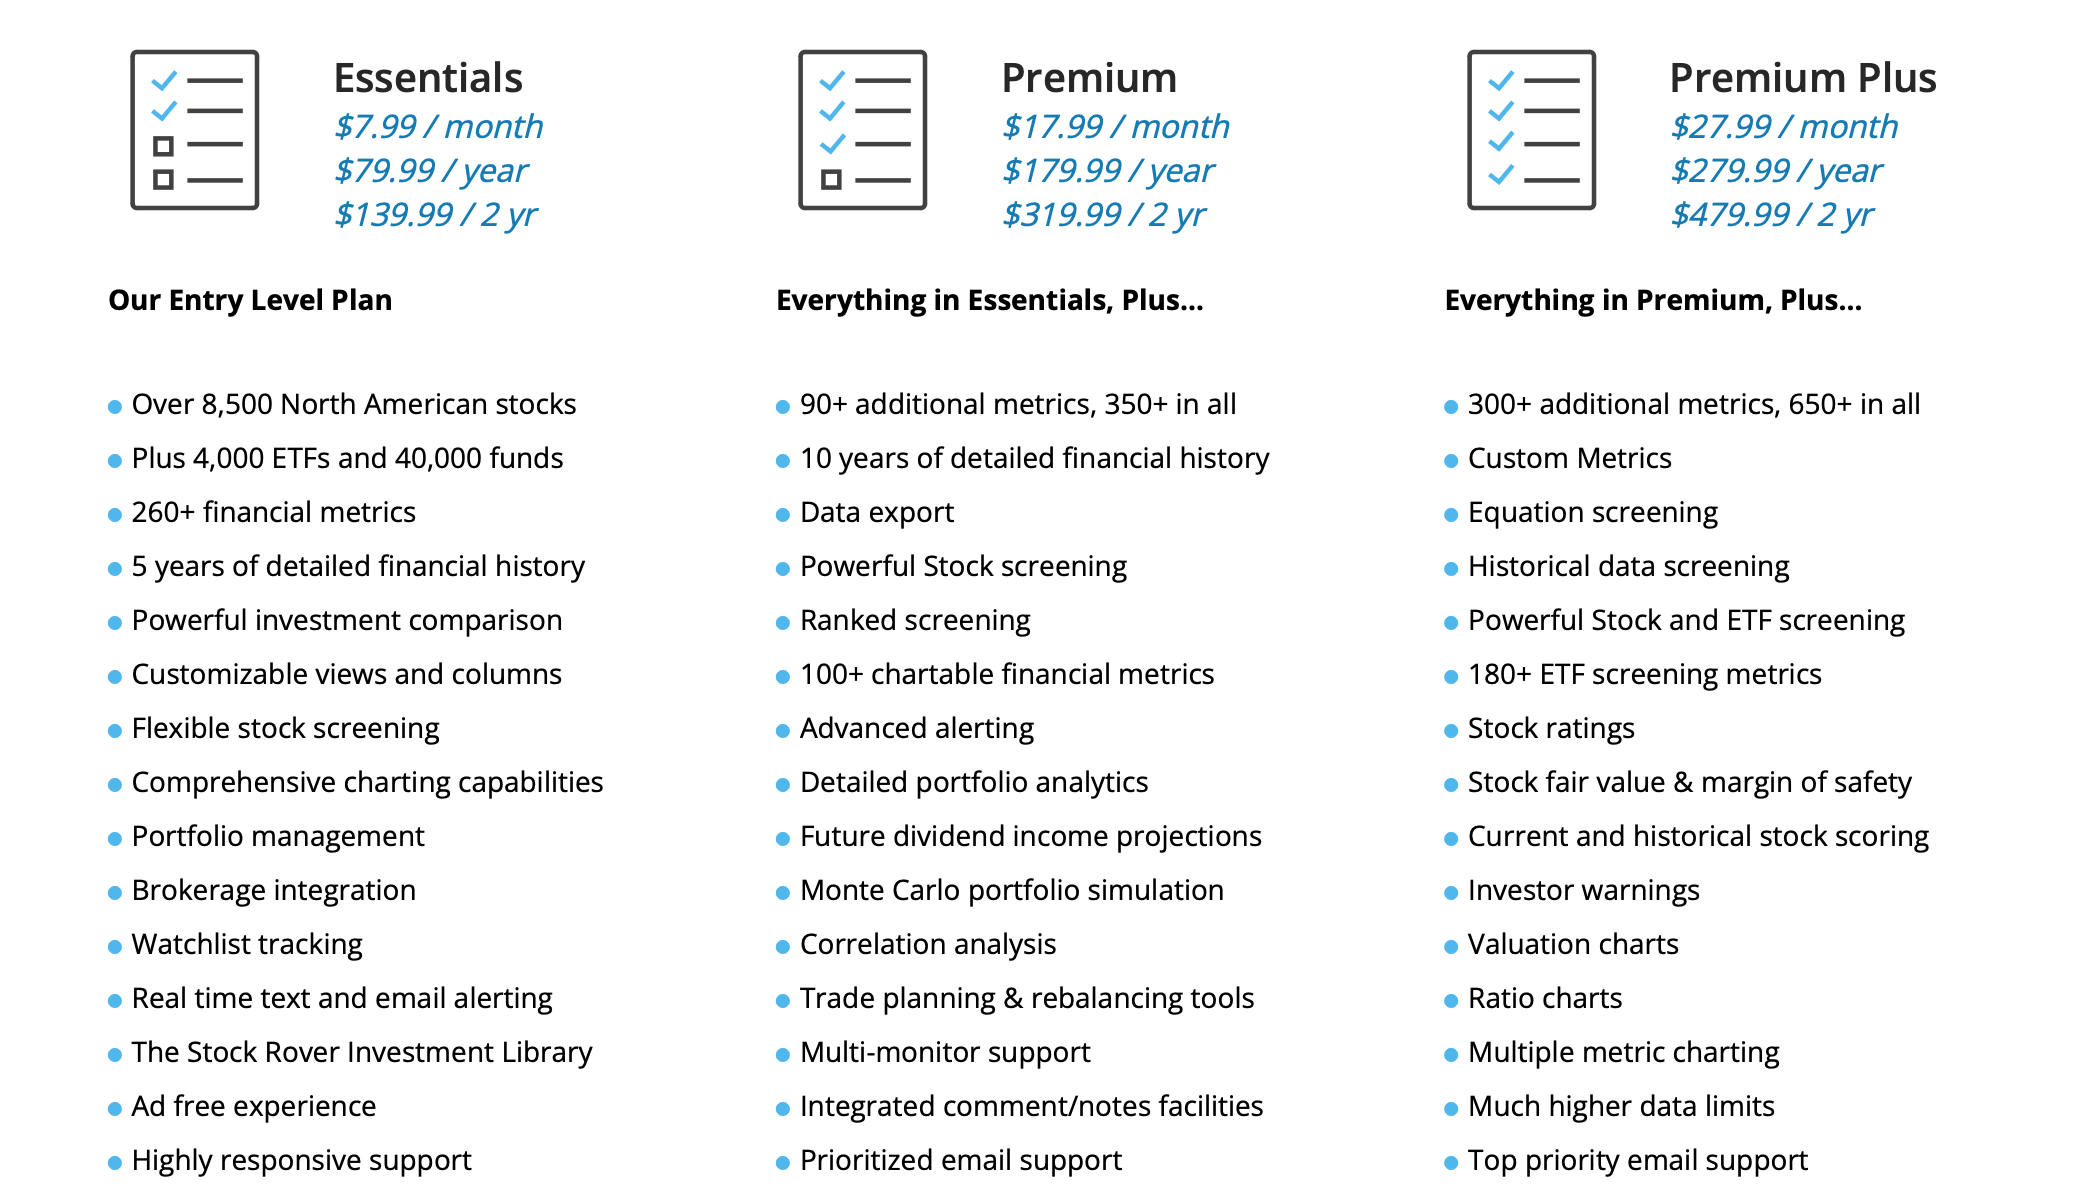
Stock Rover currently has four different plans for investors to choose from.
Free Plan
The first plan Stock Rover offers is their free plan, which surprisingly doesn’t contain any ads and still provides a base level of information for investors. This plan still offers screening data on 10,000 stocks, however the ability to analyze the stocks on both a fundamental and technical aspect is limited.
In short, while the free version provides users with a decent amount of information on individual stocks, it doesn’t offer the same in-depth insights as higher-tier plans. Stock ratings, financial metrics, and ETF screenings are just a few of the features excluded from this plan.
Stock Rover’s Essentials Plan – $7.99/month
The Stock Rover Essentials Plan provides a range of tools and features to help investors make informed decisions when trading stocks.
With access to thousands of analyst ratings from Morningstar and unique Stock Rover ratings users can quickly gain insight into a variety of different stocks or funds. Additionally, the plan includes 260 financial metrics that can be used to screen stocks more effectively, as well as an ETF screener that features over 44,000 ETFs to consider adding to your portfolio.
Perhaps most valuable, the Essentials plan provides subscribers with five years of historical company financials allowing for detailed research capabilities and portfolio analytics.
At just $7.99 per month, this plan offers many advantages over the free version, though it’s worth noting that advanced features like margin of safety calculations are only available on the Stock Rover Premium or Premium Plus plans.
Stock Rover’s Premium Plan – $17.99/month
The Stock Rover Premium Plan is designed to provide users with a comprehensive view of a stock’s performance.
This plan supports over 350 different metrics and stores up to 10 years of financial data to be reviewed and exported, making it an excellent choice for investors who want to send research to their brokerage account. Additionally, Premium subscribers receive priority customer service when contacting Stock Rover’s support team.
The monthly subscription cost for the Premium plan is $17.99, but it offers complete portfolio management, rebalancing functionality, correlation analysis, and future dividend income projection. However, users are limited to only twenty fair value and margin of safety scores per month. Those who require more can upgrade to the Premium Plus plan, but the base Premium plan is likely the best choice for most individual investors.
Stock Rover’s Premium Plus Plan – $27/month
The most inclusive and most expensive plan comes from the Stock Rover Premium Plus plan.
The Premium Plus option from Stock Rover is the top-tier subscription service, providing users with access to 650 different metrics to analyze a stock’s performance.
This plan removes all limits on key features such as stock ratings, investor warnings, fair value and margin of safety ratings, while unlocking every extra feature of the platform.
Premium Plus also offers the highest data limits of any Stock Rover plan, making it an excellent choice for active traders who require a more comprehensive view of the market.
For just $10 more per month ($27/month), users can access all of Stock Rover’s features, including complete use of all the platform’s technical indicators and detailed ratio charts. With everything you could ever need to maximize your trading potential, the Premium Plus plan offers unparalleled value for serious investors.
Who Should Use Stock Rover?

Stock Rover offers one of the most comprehensive and detailed research tools in the investment world today.
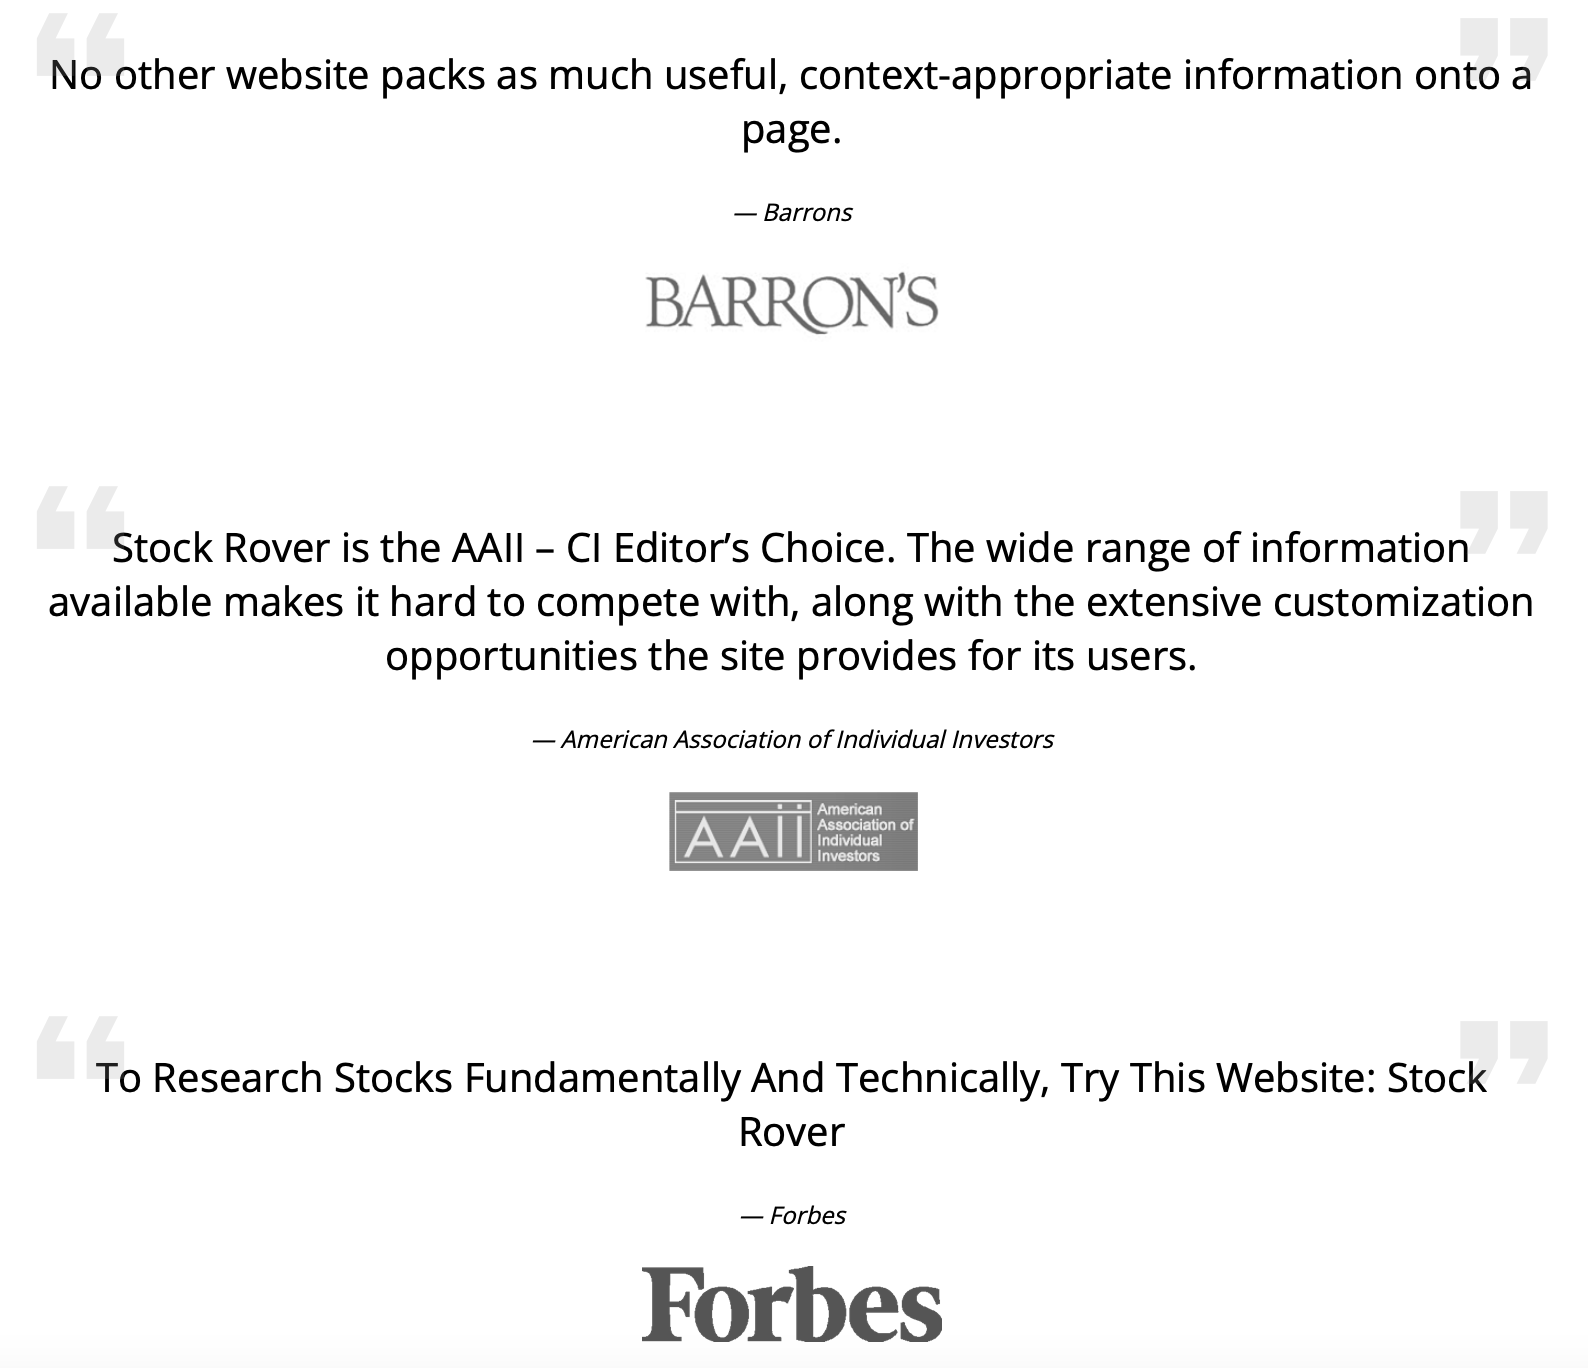
With an easy-to-use web-based platform, access to thousands of data points, the ability to compare or graph specific metrics, and manage one’s portfolio provides users with a truly unique offering they will struggle to find elsewhere. Multiple 5-star Stock Rover reviews and stellar evaluations from distinguished investing sites gives Stock Rover an added layer of credibility and trustworthiness to investors.
With a tiered pricing approach and the ability to try out the platform for free, investors get even more versatility and freedom to find the level of functionality that works best for them.
Though Stock Rover can’t actually process trades for investors, their ability to support one’s research and aid in detailed stock analysis makes this an ideal option for both long term investors, day traders, or investing newcomers who are looking to understand more on how investment research is done properly.
Is Stock Rover Worth It?
Whether or not subscribing to Stock Rover is worth it depends completely on your individual investment goals and needs.
If you’re a serious investor who wants access to comprehensive financial data and metrics to make informed decisions, Stock Rover could be a great investment. The platform offers a range of subscription options to suit different budgets and experience levels, with features like screening tools, portfolio analytics, and access to a huge database of financial data available at higher tiered plans.
However, if you’re a more casual investor who is not looking for such extensive analysis, the subscription may not be necessary. The free version of Stock Rover still offers plenty of useful tools and information and may be sufficient for those who take a more passive approach to managing their money.
Ultimately, the decision to subscribe to Stock Rover will depend on your personal investment goals and how much you’re willing to invest in a research platform. It’s always a good idea to carefully evaluate the features of the different subscription plans and compare them to your needs before making a decision.
However, if you are looking for a trustworthy and comprehensive stock analysis site – beyond what you can receive for free – Stock Rover is a premier level research platform that won’t disappoint.
Conclusion
Stock Rover is an extremely valuable investment research tool that any serious investor should consider subscribing to. With in-depth research reports, customizable stock screeners, comparison functionalities, and total portfolio analysis makes Stock Rover a truly unique offering to subscribers.
